Our Diversity pay gap report 2024 brings together data and analysis on our gender, disability, ethnicity, and sexual orientation pay gaps.
This report includes our mandatory gender pay gap report, which we are legally required to publish on an annual basis.
Executive summary
We want workplace pensions to benefit savers and work for everyone. Part of this means having a diverse mix of skills and perspectives on trustee boards to make the best decisions for savers’ retirement outcomes. At The Pensions Regulator (TPR), we want to make sure everyone is valued and can give their best, and that we have a diverse range of skills and viewpoints to be a high performing organisation that delivers good outcomes for savers.
Encouraging and supporting equality, diversity and inclusion (EDI) is fundamental to our success, and our commitment is set out in our EDI Strategy 2021 to 2025.
As part of our commitment to EDI, we set ourselves ambitious objectives in our EDI Strategy, to reduce the pay gaps for gender, ethnicity, LGB+ and disability. We also set ourselves a target to reduce our gender pay gap to 2% by 2024.
Our pay gap data for 2024 shows relatively smalls changes in comparison to 2023 with minor increases across all our pay gaps except for the median sexual orientation pay gap and mean ethnicity pay gap which had a slight decrease:
- Mean gender pay gap is 3.9%, an increase of 0.7% percentage points (pp) compared to 2023, and the median gender pay gap is 8.4%, an increase of 2.7% pp compared to 2023. We have more work to do to reach our gender pay gap target although we continue to compare favourably to the wider Civil Service, where the mean gender pay gap is 7.4% and the median gender pay gap is 8.5%1.
- Mean disability pay gap is -2.6%, in favour of employees with a disability, an increase of 0.7 pp compared to 2023. The median disability pay gap is -1.5%, in favour of employees with a disability, an increase of 0.2pp compared to 2023.
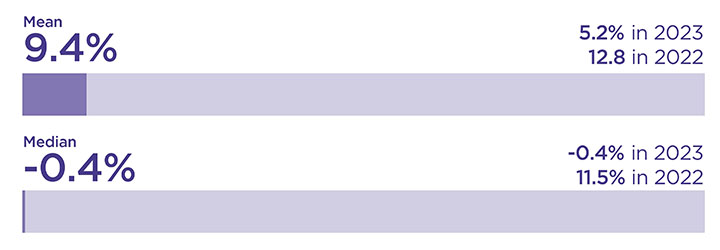
- Mean ethnicity pay gap is 14.4%, in favour of white employees, a decrease of 0.5 pp compared to 2023. The median ethnicity pay gap is 11.6%, in favour of white employees, an increase of 1.3 pp compared to 2023.
- Mean sexual orientation pay gap is 13.1%, in favour of heterosexual employees, an increase of 1.1 pp compared to 2023. The median sexual orientation pay gap is 11.6%, in favour of heterosexual employees, a decrease of 1.4 pp compared to 2023.
Salary uplifts in TPR are applied as a percentage of base and the overall trend is for more diversity in lower grades than more senior grades (with disability being the exception). This means those in higher grades receive larger increments which contributes to the observed pay gaps. In addition, the pay gaps are calculated based on diversity data that is voluntarily declared. In 2024, we observed a slight decrease in declaration rates which reduced the reliability of the calculations as they are based on an incomplete picture.
Overall, our gender pay gaps are both below 10% and our disability pay gaps are within tolerance. However, our ethnicity and sexual orientation pay gaps continue to be above 10% and we have set out an action plan to address this.
In terms of our bonus pay gap data for 2024 we observed a decrease in all, but the ethnicity median widened by 2.7pp and the sexual orientation mean increased by 4.2pp. The median stayed the same:
- Mean gender bonus pay gap is 8.8%, in favour of men, a decrease of 2.7pp compared to 2023. The median gender bonus pay gap is 14.5%, in favour of men, a decrease of 4.3 percentage points compared to 2023. The gender bonus gap is due in part to more women in the lower quartile receiving a bonus, as bonuses are calculated as a percentage of individual salary.
- Mean disability bonus gap is -17.3%, in favour of disabled employees, a decrease of 6.4 percentage points compared to 2023. The median disability pay gap is -34.8%, in favour of disabled employees, a decrease of 4.5pp compared to 2023. The disability bonus gap is due in part to more disabled people in the upper quartiles receiving a bonus, as bonuses are calculated as a percentage of individual salary.
- Mean ethnicity bonus gap is 8.7%, in favour of white employees, a decrease of 1.1 pp compared to 2023. The median ethnicity bonus gap is -16.0%, in favour of minority ethnic employees, an increase of 2.7 pp compared to 2023. The ethnicity bonus gap is driven in part by fewer people from an ethnic minority in the upper quartile than those from the lowest quartiles, as bonuses are calculated as a percentage of individual salary.
- Mean sexual orientation bonus gap is 9.4%, in favour of heterosexual employees, an increase of 4.2 pp compared to 2023. The median sexual orientation bonus gap is -0.4%, in favour of LGB+ employees, which is no change compared to 2023. The sexual orientation bonus gaps are driven in part by fewer LGB+ employees in the upper quartile than those from the lowest quartiles.
Overall, this is encouraging and suggests that the actions taken to improve the moderation process and make assessments more thorough and inclusive were effective. As bonuses are a percentage of base salary, the diversity distribution across grades affects bonus pay gaps just like it does base salary pay gaps. These gaps will likely continue until that approach is changed.
We are confident the design of our pay strategy is non-discriminatory, and this is supported through our analysis. The diversity pay gap continues to be a key consideration as we develop our future reward strategy. We are progressing a fundamental review of how TPR people are rewarded, including annual pay awards and bonuses. This work forms part of our transformation journey to evolve our organisation, embedding our four high-performance principles:
- alignment
- accountability
- collaboration
- performance mindset
Our diversity pay and bonus gap variances are impacted by the under-representation of individuals with certain characteristics in senior grades or in jobs that attract market premia, and greater representation in roles with lower pay. Improving representation across all levels of the organisation is a key part our EDI strategy.
We recognise that closing our diversity pay gaps for gender, disability, ethnicity, and sexual orientation will not be quick or simple. This is because pay gaps reflect wider internal and external factors, and we are committed to taking the necessary long-term action to reduce them. As we note below, accuracy of data depends on the declaration rates.
We have outlined the actions we are taking to improve our diversity pay gaps at the end of this report. These focus on:
- improving recruitment
- talent management
- pay and performance
Progress towards these actions is monitored by our EDI Steering Committee which advises TPR’s Executive Committee and People Division.
Introduction
Mandatory gender pay gap reporting
In 2017, the government introduced legislation requiring organisations with 250 or more employees to report annually on their gender pay gap. Government departments are covered by the Equality Act 2010 (Specific Duties and Public Authorities) Regulations 2017, which came into force on 31 March 2017. These regulations underpin the Public Sector Equality Duty and require relevant organisations to publish their gender pay gap annually.
Gender pay gap data includes the:
- mean and median gender pay gaps
- mean and median gender bonus gaps
- proportion of men and women who received bonuses
- proportions of male and female employees in each pay quartile
Gender pay gap is different from equal pay. Equal pay deals with the differences between men and women who carry out the same jobs, similar jobs or work of equal value. It is unlawful to pay people unequally because they are a man or a woman. We use the Korn Ferry job evaluation methodology to ensure equal pay for work of equal value. This report is about our pay gaps.
The gender pay gap is the difference between the average pay of men and women in a workforce, shown as the difference compared to men’s earnings.
- A positive percentage value shows women have lower pay or bonuses than men.
- A negative percentage shows that men have lower pay or bonuses than women.
- A zero-percentage shows that there is equal pay or bonuses between men and women.
A large gender pay gap in a workplace can indicate a number of issues to address. Analysing the specific calculations can help identify these issues.
This report fulfils our gender pay gap reporting requirements for the snapshot date of 31 March 2024. In addition to the mandatory reporting requirements, we have voluntarily provided insights to explain the factors contributing to our gender pay gap and the actions we’re taking to reduce it.
The gender pay gap figures are published on our public-facing website, as part of our Annual Report and Accounts, and on the Government Equalities Office (GEO) portal.
Additional voluntary pay gap reporting on disability, ethnicity, and sexual orientation
In addition to the mandatory gender pay gap reporting requirements, this is the fourth time we have voluntarily reported on our diversity pay gaps for disability, ethnicity, and sexual orientation. We believe that being open and transparent about our pay gaps is essential for creating a diverse and inclusive culture. We also support the fair treatment and reward of all regardless of their gender, disability, ethnicity, or sexual orientation.
Gender pay gap report
Gender representation
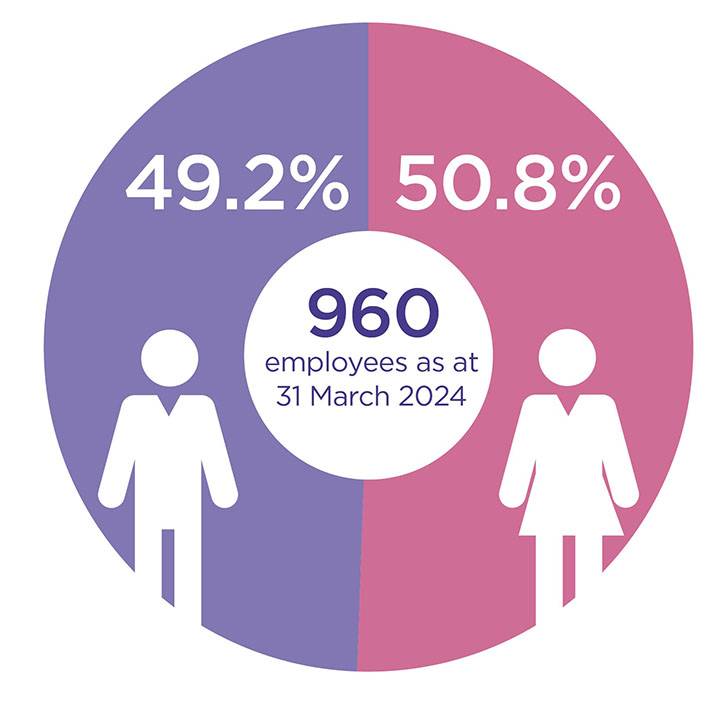
On the date of our gender pay gap snapshot, on 31 March 2024, our workforce included 960 employees (compared with 978 the previous year). 472 employees were men (49.2%) and 488 were women (50.8%). This provided a relatively even split of men and women in scope for the analysis.
Mean and median gender pay gap
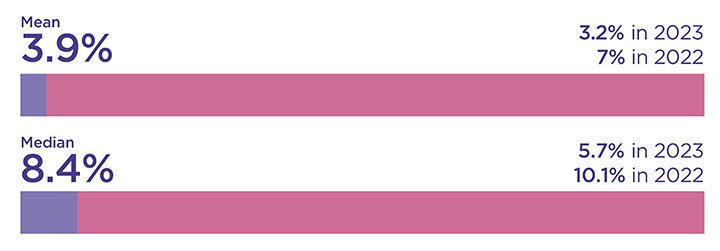
Our mean gender pay gap is 3.9%, in favour of men, an increase of 0.7 pp compared to 2023.
Our median gender pay gap is 8.4%, in favour of men, an increase of 2.7 pp.
We continue to compare favourably to the wider Civil Service, where the mean gender pay gap is 7.4% and the median gender pay gap is 8.5%2.
The proportion of women and men in each pay quartile
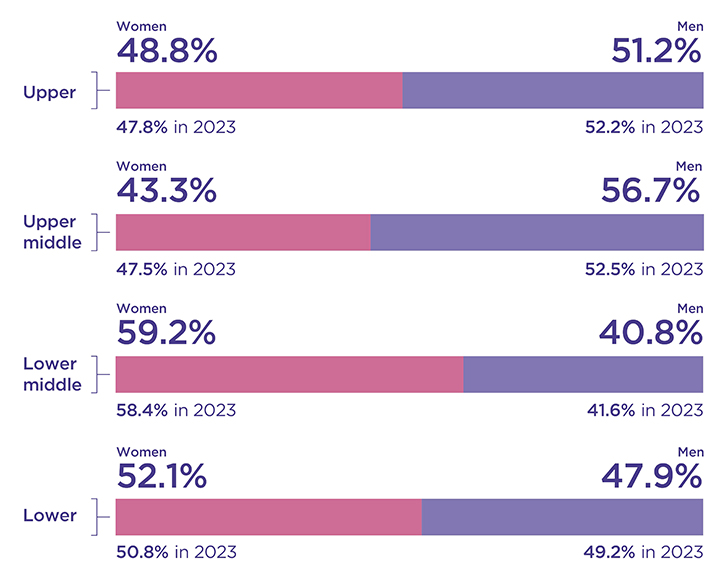
There is a higher proportion of women in the:
- lower paid, lower middle quartile (Q2) (59.2% women and 40.8% men)
- lower quartile (Q1) (52.1% women and 47.9% men)
There is a lower proportion of women in the:
- highest paid, upper quartile (Q4) (48.8% women and 51.3% men)
- upper middle quartile (Q3) (43.3% women and 56.7% men)
Mean and median gender bonus gap
The mean (average) gender bonus pay gap is the difference between the mean (average) bonus pay paid to relevant employees who are men, and bonus pay paid to relevant employees who are women (as a percentage).
The median gender bonus pay gap is the difference between the median bonus pay paid to relevant employees who are men, and the median bonus pay paid to relevant employees who are women.
Our mean bonus pay gap and median bonus pay gap have both decreased compared to 2023.
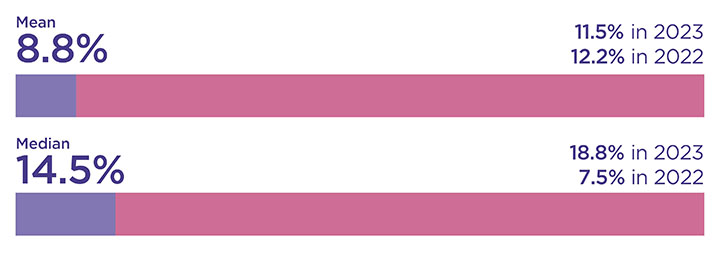
Our mean gender bonus pay gap is 8.8%, in favour of men, a decrease of 2.7 pp to compared to 2023.
Our median gender bonus pay gap is 14.5%, in favour of men, a decrease of 4.3 pp compared to 2023.
The proportion of men and women receiving bonus pay
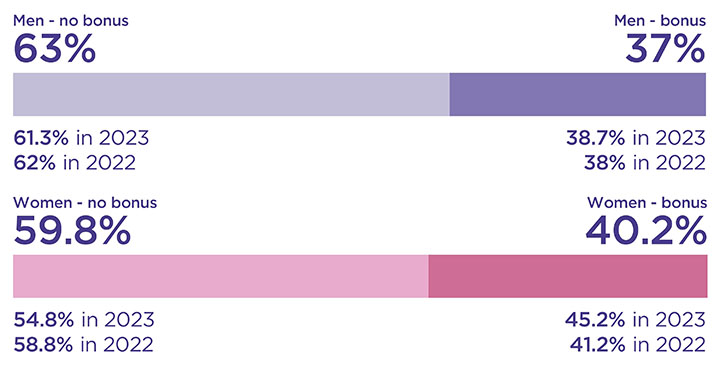
The reduction in bonus pay gaps can be attributed to the fact that a higher percentage of women received bonus awards (40.2%), a decrease of 5 pp from 45.2% in 2023 in comparison to men (37.0%), a decrease of 1.7 pp from 38.7% in 2023. However, the current bonus pay gap is mainly due to more women in the lower quartile receiving bonuses. As a result, the average bonus amount received by women is lower than the average amount received by men. This is because bonuses are calculated as a percentage of individual base salary.
Diversity pay gap data for disability, ethnicity, and sexual orientation
We have used the same method to calculate the pay and bonus pay gaps for disability, ethnicity, and sexual orientation as we do for gender.
- A positive percentage value shows the minority group have lower pay or bonuses than the majority group.
- A negative percentage shows that the majority group have lower pay or bonuses than the minority group.
- A zero-percentage show that there is equal pay or bonuses between the minority and majority group.
Reporting on the pay and bonus pay gap data for disability, ethnicity and sexual orientation is more challenging, because fewer people voluntarily declare this information compared to gender pay gap reporting (where we have 100% of the data, as it is not reliant on voluntary self-declaration).
Only employees who have chosen to voluntarily declare their disability, ethnicity or sexual orientation are included in the pay and bonus gap analysis. As a result, the analysis is done on much smaller data sets. The challenge with having small numbers in minority groups compared to a much larger population is that the data can be skewed because of the small sample sizes. Because of this, the median is likely a better measure than the mean.
Our declaration rates on 31 March 2024 were:
- 77% for disability
- 80% for ethnicity
- 75% for sexual orientation
This incomplete picture affects the accuracy of the data analysis, and where gaps do exist, it makes it more difficult for us to properly understand and tailor action to close them. To improve our data, we carry out an annual campaign to encourage employees to voluntarily share their diversity information.
Based on the workforce data that we hold, as at 31 March 2024 we know that:
- 7% of employees declared a disability
- 9% of our workforce declared they were from an ethnic minority background
- 8% of our workforce declared themselves gay, lesbian or bisexual
Our data shows there are few ethnic minorities and LGB+ people in senior leadership level roles. We believe this is a significant reason for our pay gaps in ethnicity and sexual orientation. It is a focus for us in our EDI strategy, to improve representation within our executive committee, senior leadership team and across all levels of the organisation.
Disability pay gap report
We continued to make positive progress in reducing the mean and median disability pay gaps. There is less disparity in hourly rates of pay between employees who declared themselves as disabled compared with those who identified as being non-disabled.
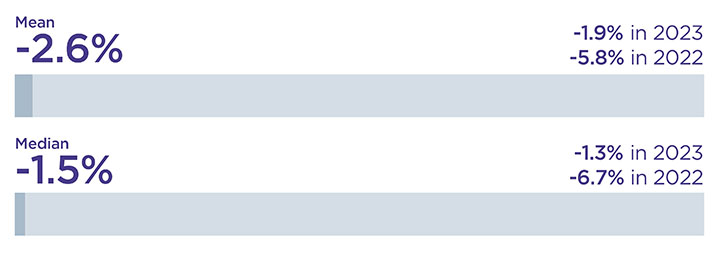
Our mean disability pay gap is -2.6%, in favour of employees with a disability, an increase of -0.7 pp compared to 2023.
Our median disability pay gap is -1.5%, in favour of employees with a disability, an increase of -0.2 pp compared to 2023.
The proportion of disabled and non-disabled employees in each pay quartile
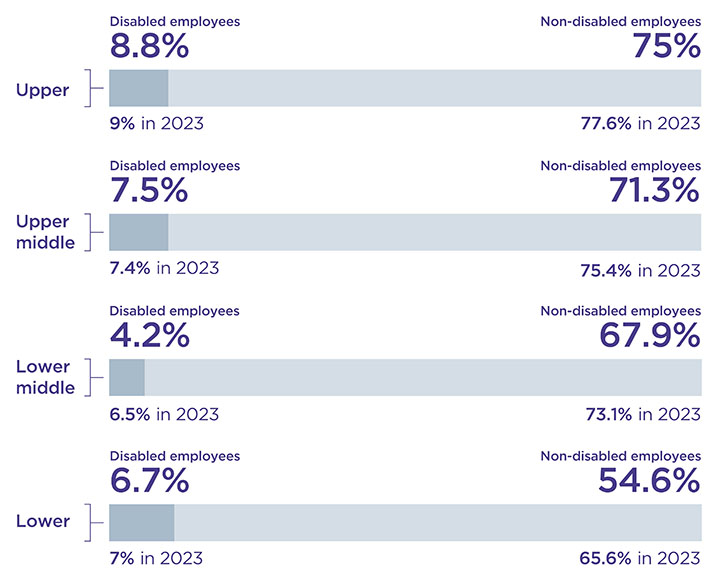
The proportion of disabled employees continues to be lower compared to non-disabled employees across all four quartiles. There is a higher proportion of disabled employees in the upper and upper middle (highest paid) quartiles.
Mean and median disability bonus gap
The mean and median disability bonus pay gap has decreased compared to 2023. It continues to be more favourable for those who have declared themselves as disabled in comparison to non-disabled employees.
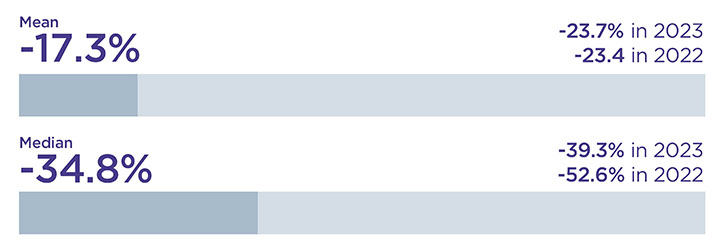
Our mean disability bonus gap is -17.3%, in favour of disabled employees, a decrease of 6.4 pp compared to 2023.
Our median disability pay gap is -34.8%, in favour of disabled employees, a decrease of 4.5 pp compared to 2023.
The proportion of disabled and non-disabled employees receiving bonus pay
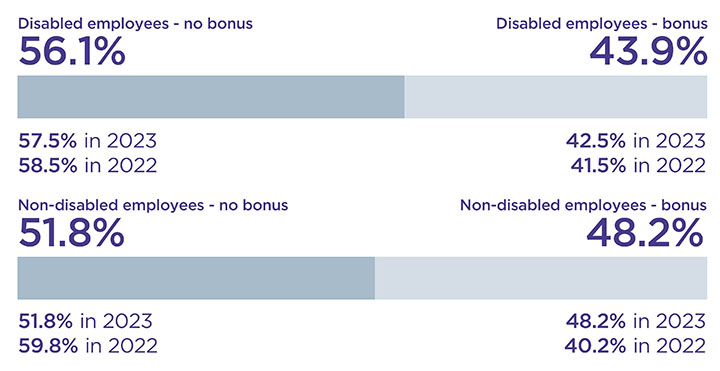
A slightly higher proportion of non-disabled employees received bonus pay compared to employees that declared a disability (48.2% non-disabled and 43.9% disabled).
The percentage of disabled employees receiving a bonus was 43.9%, an increase of 1.4 pp compared to 2023.
The bonus pay gap is largely due to more disabled people in the upper quartiles receiving a bonus, as bonuses are calculated as a percentage of base salary.
Ethnicity pay gap report
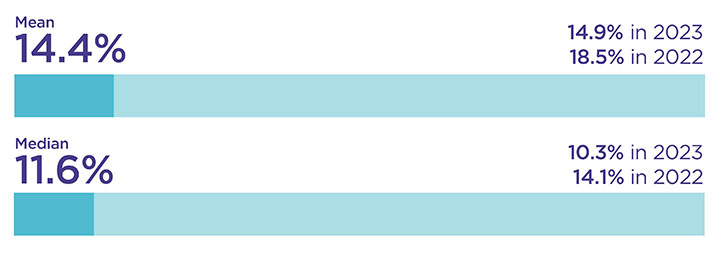
Our mean ethnicity pay gap is 14.4%, in favour of white employees, in comparison to minority ethnic employees, a decrease of -0.5 pp compared to 2023.
Our median ethnicity pay gap is 11.6%, in favour of white employees, in comparison to minority ethnic employees, an increase of 1.3 pp compared to 2023.
The proportion of minority ethnic and white employees in each pay quartile
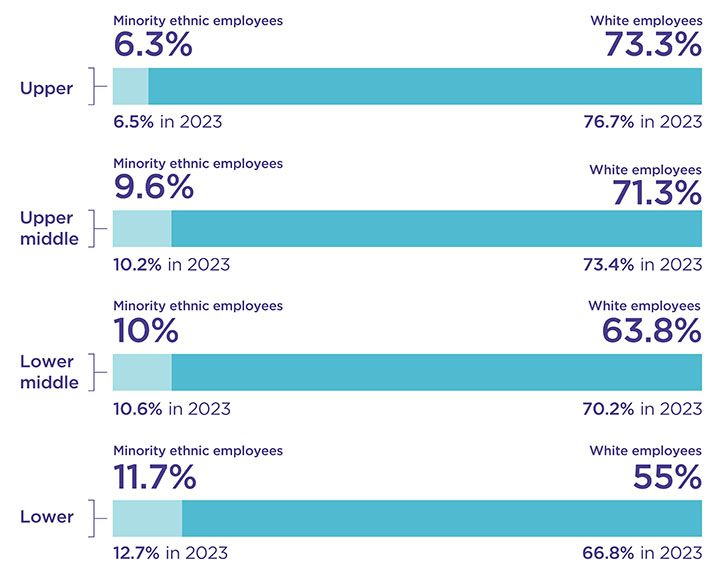
There continues to be a lower proportion of minority ethnic employees across all four quartiles compared to white employees.
We have seen slight changes in our ethnicity pay gaps. This is because more minority ethnic employees are in the lower-paid groups (11.7% in the lower quartile and 10% in the lower middle quartile). A greater number of white colleagues are in the higher-paid groups (73.3% in the upper quartile and 71.3% in the upper middle quartile). If this trend continues, ethnicity pay gaps will likely persist.
Mean and median ethnicity bonus gap
We have made positive progress in reducing the mean bonus pay gap although the median has widened.
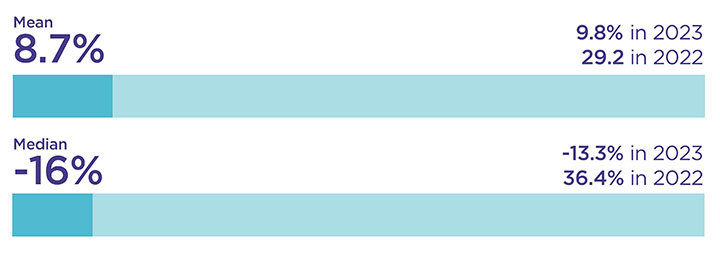
Our mean ethnicity bonus pay gap is 8.7%, in favour of white employees, a decrease of 1.1 pp compared to 2023.
Our median ethnicity bonus pay gap is -16.0%, in favour of minority ethnic employees, an increase of -2.7 pp compared to 2023.
The proportion of minority ethnic and white employees receiving bonus pay
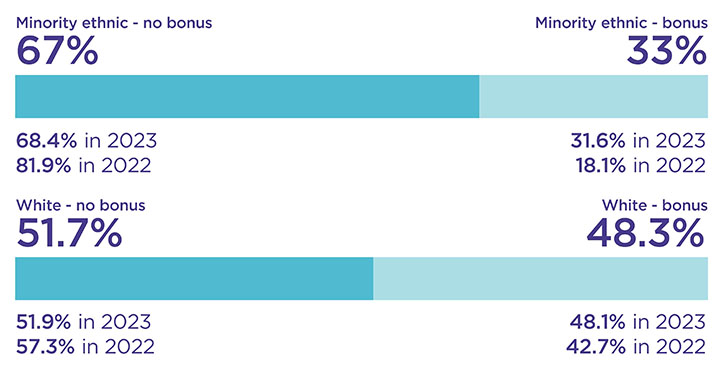
A higher proportion of white employees received bonus pay, 48.3% (a 0.2 pp increase from 2023) compared to minority ethnic employees, 33% (a 1.4 pp increase from 2023).
The ethnicity bonus pay gap is due in part because fewer people from an ethnic minority were awarded bonuses compared to white colleagues (15.3 pp difference). This issue is exacerbated because bonuses are based on a percentage of base salary and there are more white employees in higher-paying positions (upper quartiles) and fewer in lower-paying ones (lower quartiles), while the opposite is true for minority ethnic colleagues.
Sexual orientation pay gap report
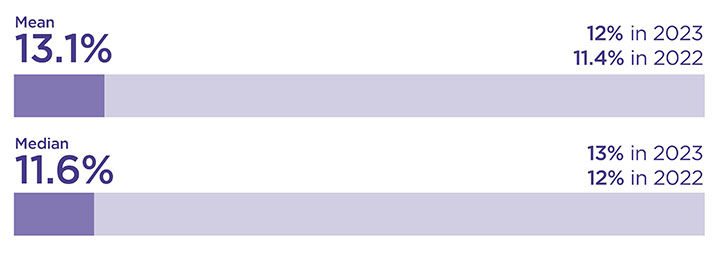
The mean and median sexual orientation pay gaps persist and are less favourable for those who identify as lesbian, gay, bisexual or recorded their sexual orientation as ‘other’ (LGB+) compared to heterosexual employees. Our mean sexual orientation pay gap is 13.1%, in favour of heterosexual employees, an increase of 1.1 pp compared to 2023.
Our median sexual orientation pay gap is 11.6%, in favour of heterosexual employees, a decrease of -1.40 pp compared to 2023.
The proportion of LGB+ and heterosexual employees in each pay quartile

There continues to be a lower proportion of LGB+ employees across all four quartiles compared to heterosexual employees.
There are more LGB+ employees in the lower (9.6%) and upper middle (9.6%) quartiles. There is a higher number of heterosexual colleagues in the higher paid upper (68.8%) and upper middle (65.8%) quartiles.
The pay gap is driven by fewer LGB+ employees in higher-paying positions (upper quartile) and more in lower-paying ones (lowest quartiles), while there are more heterosexual employees in higher-paying positions (upper quartiles) than lower-paying ones (lowest quartiles).
Mean and median sexual orientation bonus gap
The mean sexual orientation bonus pay gap is less favourable for LGB+ employees compared to heterosexual employees at 9.4%, an increase of 4.2 pp compared to 2023.
The median sexual orientation bonus pay gap remains unchanged compared to 2023 at -0.4%, in favour of LGB+ employees.
The proportion of LGB+ and heterosexual employees receiving bonus pay
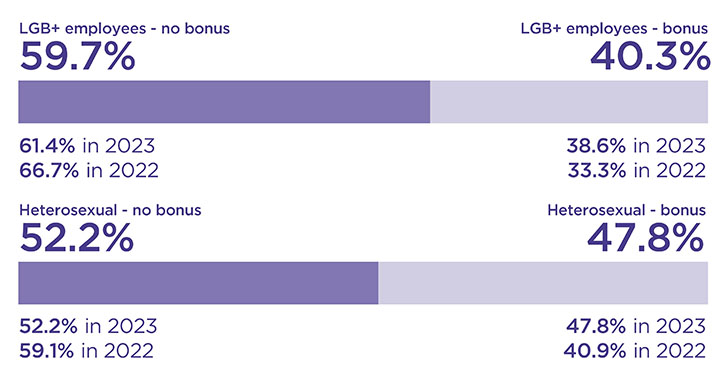
The percentage of LGB+ employees receiving a bonus was 40.3%, an increase of 1.7 percentage points compared to 2023 and a higher proportion of employees who identified as heterosexual received bonus pay (47.8%).
The sexual orientation bonus pay gaps are driven in part because fewer LGB+ employees received a bonus payment. Additionally, there are more heterosexual employees in higher-paying positions (upper quartile) and fewer in lower-paying ones (lowest quartiles).
If we do not recruit more LGB+ employees into higher-paying positions (upper quartile), these sexual orientation pay gaps are likely to continue for a long time.
Taking action on our diversity pay gaps
Key actions we have taken to improve our pay gaps over the last year
Recruitment
We conducted extensive work to make the recruitment process more inclusive by using diverse panels for all senior recruitment and maximising creative advertising. We launched a new candidate charter outlining our commitments to candidates to ensure they are supported through each step of the recruitment process and our process is fair and equitable throughout. The charter welcomes feedback from candidates about their experience of the recruitment journey to enable continuous improvement of our services.
We continued to offer tailored recruitment sessions to our colleague diversity networks and ensured that all hiring managers have one-to-one campaign meeting with a recruitment partner which includes discussion around diversity considerations.
In addition, we scoped an applicant tracking system which is due for implementation in July 2025.
Learning and development
We delivered inclusive leadership and diversity training for our Executive Committee in October 2024. Alongside this we continue to ask all new staff to complete mandatory eLearning ‘Civil Service Expectations’ designed to increase awareness and understanding of their responsibilities on equality, diversity and inclusion.
Policy
We included EDI considerations in our planned HR policy review. The EDI Team were involved from the beginning, ensuring we completed an Equality Impact Assessment and got feedback from relevant diversity network groups when needed.
We conducted our annual ‘Count me in’ declaration drive in September 2024 to improve the reliability of diversity data and accurate pay gap reporting. We have strengthened this approach by taking further targeted action at directorate level to increase diversity declaration rates.
We utilised our management information to provide directorate-level data that can support them in taking actions that address diversity pay gaps.
We utilised the findings from this pay gap report to refresh our annual EDI action plan to ensure our policies and focus remain effective and up to date.
Pay and performance
We completed an independent review of our bonus approach and our three-year review of our pay data to test if our reward strategy is working as intended. We are using the findings from these reviews to plan further action to improve pay and bonus gaps.
We introduced a balanced scorecard at Executive Committee level to help leaders understand and deliver what is expected of them and to ensure their teams do the same. We are refreshing our approach to setting objectives and continue to clearly communicate with staff and people managers about timescales and the quality of objectives.
We appointed executive committee-level sponsors to each diversity network to help raise the profile of their network and effectively influence decision making at executive and board level.
We signed up to a range of benchmarks and accreditations to showcase our support for EDI and access useful tools and resources.
We will provide a report of progress towards our wider EDI strategy in our Annual Report and Accounts 2024 to 2025, to be published in summer 2025.
Future actions we are taking to improve our pay gaps
While we are encouraged by the progress towards reducing some of our pay gaps this year, we know we have more work to do. We will continue to build on the actions outlined above with a specific focus on recruitment, talent management, pay and performance over the next year.
The rollout of our applicant tracking system will allow us to monitor diversity throughout our recruitment process. By the end of 2025 we will use insights from this system to track and assess candidate diversity and take appropriate action to increase the recruitment of candidates from diverse backgrounds.
We will commence hiring manager training which will cover inclusive hiring techniques to raise knowledge, consistency and standards of our recruitment processes between July and September 2025.
We will keep encouraging new starters to make diversity declarations during onboarding and existing employees to do so through the annual declaration drive. This will help ensure our reporting is based on accurate and reliable data.
We are developing a talent management pathway launching between April and June 2025, with clear and transparent development routes for everyone.
We will develop a framework for initiatives and development programmes focused on underrepresented groups. Our objective is to improve internal mobility and increase the representation of LGB+ and ethnic minority colleagues in senior positions by June 2025, with plans to launch by the September 2025.
After the pay review earlier this year we are implementing significant changes to our pay practices on a phased basis, starting on 1 April 2024. We will begin by narrowing our pay bands to reduce the differences in pay within grades, which contributes to the pay gaps.
We have paused the performance related pay element of our reward approach which rewarded individuals based on their performance marking. Instead, in 2023 to 24 pay increases were applied to all colleagues based on their position in the pay band with no increases given to those marked as below expectations. This will increase the focus on personal growth and career development, as well as accountability and performance. It will ensure clarity and consistency in how performance is management and assessed.
We have implemented a graduated approach to pay increases. where those at the bottom of the pay band receive a larger percentage increase than those closer to the top. We will build on this approach seeking to apply pay increases based on the pay band median rather than individual pay positions, so everyone gets the same monetary increase, regardless of their starting pay position or how long they have been in the organisation. This will reduce potential disparities. Last year we applied bonus pay based on the pay band median rather than individual pay positions. This will move forward as we evolve our reward practice. Like the approach to pay increases this should reduce disparities in bonus amounts received at each grade level.
Finally, we will use an evidence-based approach to conduct a review of our progress on EDI between 2021 and 2025 and inform our revised EDI strategy from 2025 to 2026.
Declaration
We confirm that data reported by the Gender Pay Gap Report 2024 is accurate and has been calculated according to the requirements and methodology set out in the Equality Act 2010 (Specific Duties and Public Authorities) Regulations 2017.

Andrea Gordon
Chief People Officer
Endnote for this page
- Transgender and non-binary staff reporting – the Equality Act 2010 (Gender Pay Gap Information) Regulations 2017 require employers to calculate their gender pay gap by comparing the pay of their male and female employees. The terms 'men' and 'women' are not defined in the regulations, leaving employers to decide for themselves how to categorise and include transgender and non-binary employees in their reporting. Government guidance says if the employee does not self-identify as either male or female, they can be omitted from calculations.
At TPR, we capture data on sex under three options, 'male', 'female' and 'other'. In line with the regulations, only those who self-identify as 'male' or 'female' are included in the calculations. Those who self-identify as 'other' are omitted from the gender calculations as the sample size is too small, and we would not be able to protect anonymity. We do not capture data on gender identity. We capture data on gender reassignment, but we are unable to report on gender reassignment calculations as the sample size is too small, and we would not be able to protect anonymity. We acknowledge that this does not reflect our efforts towards inclusion of the trans and non-binary community and we are exploring how our reporting can be more inclusive going forward.
- The 'Ethnic' category includes 'Other ethnic groups' and the 'LGB+' category includes people who identify their sexuality as 'other'. For calculations including bonus, any bonuses paid to people leaving TPR during the relevant year are excluded.