This is our third diversity pay gap report, which brings together data and analysis on our gender, disability, ethnicity, and sexual orientation pay gaps.
This report includes our mandatory gender pay gap report, which we are legally required to publish on an annual basis.
Executive summary
We aim to make workplace pensions work for savers. Primarily, this means two things. Firstly, having the right mix of skills at trustee boards – cognitive diversity – so that those governing savers’ retirement incomes make the best possible decisions for them. Secondly, making sure that we and others understand how we can make sure that, systemically, pensions work for everyone. As a regulator, we want to ensure everyone is valued and can give their best, and that we have a diverse range of skills and viewpoints to be a high performing organisation, delivering good outcomes for savers.
Encouraging and supporting equality, diversity and inclusion (EDI) is fundamental to our success, and our commitment is set out in our EDI Strategy 2021 to 2025.
As part of our commitment to EDI, we set ourselves ambitious objectives in our EDI Strategy to reduce the pay gaps for gender, ethnicity, LGB+ and disability. We also set ourselves a target to reduce our gender pay gap to 2% by 2024.
Overall, we have made positive progress in reducing the mean and median gender, disability, ethnicity and sexual orientation pay gaps since 2022. Great progress has been made in relation to our gender pay gaps, which are below 10%, as well as our disability pay gaps, which are within our target of no more than 3% and no less than –3%. However, we recognise that we need to do more, and a concerted effort is required to address our ethnicity and sexual orientation pay gaps, which are still above 10%.
Our pay gap data shows the following.
- The mean gender pay gap is 3.2%, a decrease of 3.8 percentage points compared to 2022, and the median gender pay gap is 5.7%, a decrease of 4.4 percentage points compared to 2022. We continue to compare favourably to the wider Civil Service, where the mean gender pay gap is 8.1% and the median gender pay gap is 9.6%1.
- The mean disability pay gap is -1.9%, in favour of employees with a disability, a decrease of 3.8pp compared to 2022. The median disability pay gap is -1.3%, in favour of employees with a disability, a decrease of 5.5pp compared to 2022.
- The mean ethnicity pay gap is 14.9%, in favour of white employees, a decrease of 3.6 percentage points compared to 2022. The median ethnicity pay gap is 10.3%, in favour of white employees, a decrease of 3.8 percentage points compared to 2022.
- The mean sexual orientation pay gap is 12.0%, in favour of heterosexual employees, an increase of 0.6 percentage point compared to 2022. The median sexual orientation pay gap is 13.0%, in favour of heterosexual employees, an increase of 1.0 percentage point compared to 2022.
Whilst we have made positive progress in reducing our pay gaps, we maintain significant bonus gaps across all categories, with disability showing the largest gap.
Our bonus gap data shows us the following:
- The mean gender bonus pay gap is 11.5%, in favour of men, a decrease of 0.7 percentage points to compared to 2022. The median gender bonus pay gap is 18.8%, in favour of men, an increase of 11.3 percentage points, from 7.5% in 2022. The gender bonus gap is driven in part to more women in the lower quartile receiving a bonus, as bonuses are calculated as a percentage of individual salary.
- The mean disability bonus gap is -23.7%, in favour of disabled employees, an increase of 0.3 percentage points compared to 2022. The median disability pay gap is -39.3%, in favour of disabled employees, a decrease of 13.3 percentage points compared to 2022. The disability bonus gap is driven in part to more disabled people in the upper quartiles receiving a bonus, as bonuses are calculated as a percentage of individual salary.
- The mean ethnicity bonus gap is 9.8%, in favour of white employees, a decrease of 8.7 percentage points compared to 2022. The median ethnicity bonus gap is -13.3%, in favour of minority ethnic employees, a decrease of 27.4 percentage points compared to 2022. The ethnicity bonus gap is driven in part to fewer people from an ethnic minority in the upper quartile than those from the lowest quartiles, as bonuses are calculated as a percentage of individual salary.
- The mean sexual orientation bonus gap is 5.2%, in favour of heterosexual employees, a decrease of 7.6 percentage points compared to 2022. The median sexual orientation bonus gap is -0.4%, in favour of LGB+ employees, a decrease of 11.1 percentage points compared to 2022. The sexual orientation bonus gaps are driven in part by fewer LGB+ employees in the upper quartile than those from the lowest quartiles.
We are confident that our pay strategy is non-discriminatory in its design, and this is supported through our analysis. The diversity pay gap continues to be a key consideration as we develop our future reward strategy. By the end of March 2024, working in partnership with external specialists, we will have completed a review of our bonuses, including an evaluation of our practices across different roles and pay gaps and those with protected characteristics.
Our diversity pay and bonus gap variances are impacted by the under-representation of individuals with these characteristics in senior grades or in jobs that attract market premia. Improving representation within our executive committee, senior leadership team and across all levels of the organisation is a key part our EDI strategy.
We recognise that closing our diversity pay gaps for gender, disability, ethnicity, and sexual orientation will not be quick or simple, because pay gaps reflect wider internal and external factors, and we’re committed to taking the necessary long-term action to reduce them.
We have outlined the actions we are taking to improve our diversity pay gaps at the end of this report. These focus on improving recruitment, learning and development, policy, and pay and performance. Progress towards these actions is monitored by our EDI Committee.
Introduction
Mandatory gender pay gap reporting
In 2017, the government introduced legislation requiring organisations with 250 or more employees to report annually on their gender pay gap. Government departments are covered by the Equality Act 2010 (Specific Duties and Public Authorities) Regulations 2017, which came into force on 31 March 2017. These regulations underpin the Public Sector Equality Duty and require relevant organisations to publish their gender pay gap annually.
Gender pay gap data includes the mean and median gender pay gaps, the mean and median gender bonus gaps, the proportion of men and women who received bonuses, and the proportions of male and female employees in each pay quartile.
Gender pay gap is different from equal pay. Equal pay deals with the differences between men and women who carry out the same jobs, similar jobs or work of equal value. It is unlawful to pay people unequally because they are a man or a woman. We use the Korn Ferry job evaluation methodology to ensure equal pay for work of equal value. This report is about our pay gaps.
The gender pay gap shows the difference between the average pay of men and women in a workforce, expressed relative to men’s earnings. A positive percentage value shows women have lower pay or bonuses than men. A negative percentage shows that men have lower pay or bonuses than women. A zero-percentage shows that there is equal pay or bonuses between men and women.
If a workplace has a particularly large gender pay gap, this can indicate there may be a number of issues to address, and the individual calculations may help to identify what those issues are.
This report fulfils our gender pay gap reporting requirements for the snapshot date of 31 March 2023. In addition to the mandatory reporting requirements, we have voluntarily provided narrative to explain the factors contributing to our gender pay gap and the actions we’re taking to reduce it.
The gender pay gap figures are published on this website, as part of our Annual Report and Accounts, and on the Government Equalities Office (GEO) portal.
Additional voluntary pay gap reporting on disability, ethnicity, and sexual orientation
In addition to the mandatory gender gay gap reporting requirements, this is the third time we have voluntarily reported on our diversity pay gaps for disability, ethnicity, and sexual orientation, although there is no mandatory reporting requirement for us to do so. We do this as we believe being open and transparent about our pay gaps is essential to help us achieve a diverse and inclusive culture, and because we support the fair treatment and reward of all colleagues irrespective of their gender, disability, ethnicity, or sexual orientation.
Gender pay gap report
Gender representation
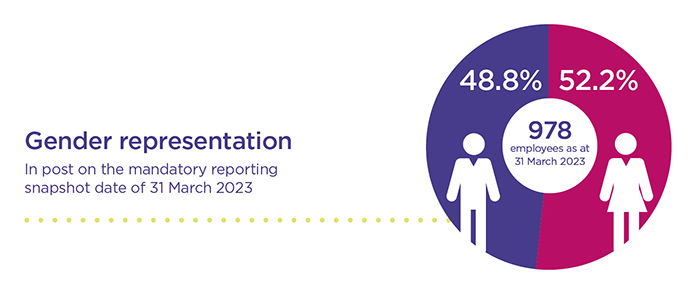
There were 978 employees within our workforce who came within the scope of the gender pay gap reporting requirements on the snapshot date of 31 March 2023, made up of 500 women (52.2%) and 478 men (48.8%) respectively, (compared with 890 the previous year).
This provided for a relatively even split of men and women in scope for the analysis.
Mean and median gender pay gap
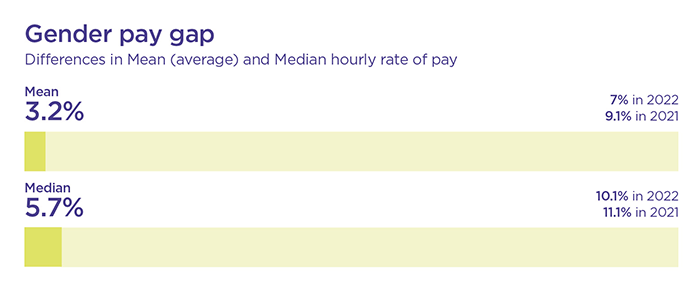
We have made positive progress in reducing the mean and median gender pay gaps since 2022.
Our mean gender pay gap is 3.2%, in favour of men, a decrease of 3.8 percentage points compared to 2022.
Our median gender pay gap is 5.7%, in favour of men, a decrease of 4.4 percentage points compared to 2022.
We continue to compare favourably to the wider Civil Service, where the mean gender pay gap is 8.1% and the median gender pay gap is 9.6%2 .
| Difference in mean (average) hourly rate of pay | Difference in median hourly rate of pay | |
|---|---|---|
| 2023 | 3.2% | 5.7% |
| 2022 | 7% | 10.1% |
| 2021 | 9.1% | 11.1% |
The proportion of men and women in each pay quartile
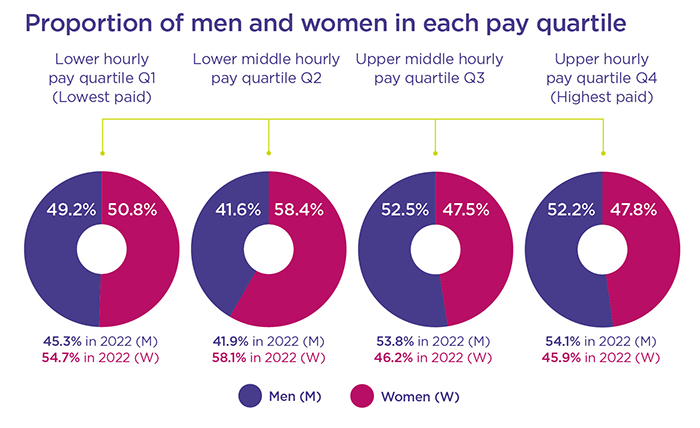
There have been no significant changes in the proportion of women across the four quartiles since 2022, with a 1.9 percentage point increase in the upper quartile (Q4), 1.3 percentage points decrease in the upper middle quartile (Q3), 0.3 percentage points increase in the lower middle quartile (Q2), and 3.9 percentage points decrease in the lower quartile (Q1).
There continues to be a slightly lower proportion of women in the highest paid, upper quartile (Q4) (47.8% women and 52.2% men) and the upper middle quartile (Q3) (47.5% women and 52.5% men) and higher proportion in the lower paid, lower middle quartile (Q2) (58.4% women and 41.6% men), and slightly higher proportion in the lower quartile (Q1) (50.8% women and 49.2% men).
| Quartiles3 - Men | Quartiles3 - Women | |
|---|---|---|
| Q4 – Upper hourly pay quartile (Highest paid) | 52.2% (54.1%) * | 47.8% (45.9%) |
| Q3 – Upper middle hourly pay quartile | 52.5% (53.8%) | 47.5% (46.2%) |
| Q2 – Lower middle hourly pay quartile | 41.6% (41.9%) | 58.4% (58.1%) |
| Q1 – Lower hourly pay quartile (lowest paid) | 49.2% (45.3%) | 50.8% (54.7%) |
* NB: The figures in brackets illustrate the proportion of men and women in each of the four quartiles from the 2022 gender pay analysis and have been included for comparative purposes.
3 A quartile is one of four equally sized groups created when you divide a selection of numbers that are in ascending order into four. The "lower quartile" is the lowest group. The "upper quartile" is the highest group.
Mean and median gender bonus gap
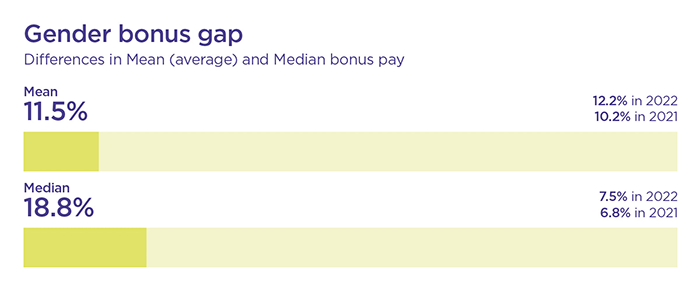
Our mean bonus pay gap is 11.5%, a decrease of 0.7 percentage points, compared to 2022.
Our median bonus pay gap is 18.8%, an increase of 11.3 percentage points, from 7.5% in 2022.
Although a higher percentage of women received bonus awards in comparison to men, the bonus gap is largely attributable to a higher proportion of women in the lower quartile receiving a bonus. This decreases the average bonus in favour of men, as bonuses are calculated as a percentage of individual salary.
| Difference in mean bonus pay | Difference in median bonus pay | |
|---|---|---|
| 2023 | 11.5% | 18.8% |
| 2022 | 12.2% | 7.5% |
| 2021 | 10.2% | 6.8% |
The percentage of men and women receiving bonus pay
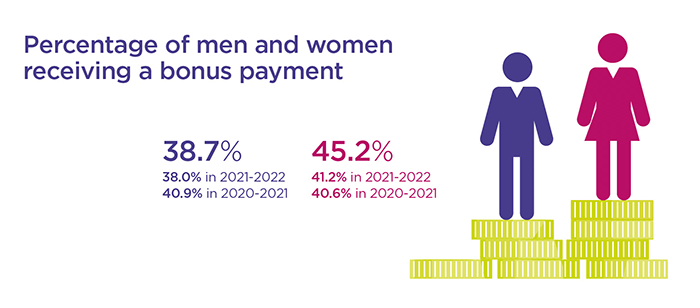
A higher percentage of women received bonus pay compared to men (45.2% women and 38.7% men4).
The proportion of women receiving a bonus was 45.2%, an increase of 4.0 percentage points from 41.2% in 2022, compared to 38.7% of men, a slight increase of 0.7 percentage points.
4 This figure is calculated by dividing the number of men who received a bonus in the 12 months to the reporting date, by the total number of men, which explains why it does not add up to 100%.
Percentage of men and women receiving bonus pay in the 12 months ending 31 March
| 20/21 | 21/22 | 22/23 | |
|---|---|---|---|
| Men | 40.9% | 38.0% | 38.7% (increased by 0.7ppt) |
| Women | 40.6% | 41.2% | 45.2% (increased by 4ppt) |
Diversity pay gap data for disability, ethnicity, and sexual orientation
We voluntarily report on our diversity pay gaps for disability, ethnicity, and sexual orientation, alongside our gender pay gap reporting requirements, although there is no mandatory reporting requirement for us to do so. We do this as we believe being open and transparent about our pay gaps is essential to helping us achieve a diverse and inclusive culture, and because we support the fair treatment and reward of all colleagues irrespective of their gender, disability, ethnicity, or sexual orientation.
We have applied the same methodology that is used to calculate gender pay and bonus gaps to calculate the pay gap for disability, ethnicity, and sexual orientation.
A positive percentage value shows the minority group have lower pay or bonuses than the majority group. A negative percentage shows that the majority group have lower pay or bonuses than the minority group. A zero-percentage show that there is equal pay or bonuses between the minority and majority group.
Reporting on the pay and bonus gap data for disability, ethnicity and sexual orientation presents more of challenge, because typically voluntary declaration rates are lower in comparison to gender pay gap reporting (where we have 100% of the data, as it is not reliant on voluntary self-declaration).
Only employees who have chosen to voluntarily declare their disability, ethnicity or sexual orientation are included in the pay and bonus gap analysis. The knock-on effect of this is that the analysis has to be conducted on much smaller data sets. The challenge with small numbers in the minority groups versus a much bigger comparator population is that you can get data skews, due to such small sample sizes.
In light of that, the median is probably a better indicator than the mean.
Our declaration rates on 31 March 2023 were 79% for disability, 80% for ethnicity and 74% for sexual orientation. This incomplete picture affects the accuracy of the data analysis, and where gaps do exist, it makes it more difficult for us to properly understand and tailor action to close them. To improve our data, we carry out an annual campaign to encourage employees to voluntarily share their diversity information.
Based on the workforce data that we hold, as at 31 March 2023 we know that 7% of employees declared a disability, 10% of our workforce declared they were from an ethnic minority background, and 8% of our workforce declared themselves gay, lesbian or bisexual.
Further examination of our data indicates that there is low representation of ethnic minorities and people from the LGB+ community within our senior leadership levels within the organisation and we believe this is a significant driver of our pay gaps for ethnicity and sexual orientation. Improving representation within our executive committee, senior leadership team and across all levels of the organisation is a focus for us in our EDI strategy.
Disability pay gap report
We continued to make positive progress in reducing the mean and median disability pay gaps, with limited difference in hourly rates of pay between employees who declared themselves as disabled compared with those who identified as being non-disabled.
Our mean disability pay gap is -1.9%, in favour of employees with a disability, a decrease of 3.8 percentage points compared to 2022.
Our median disability pay gap is -1.3%, in favour of employees with a disability, a decrease of -5.4 percentage points compared to 2022.
| Difference in mean (average) hourly rate of pay | Difference in median hourly rate of pay | |
|---|---|---|
| 2023 | -1.9% | -1.3% |
| 2022 | -5.8% | -6.7% |
| 2021 | -12.7% | -17.6% |
Mean and median disability bonus gap

The mean disability bonus gap has increased slightly, and the median bonus gap has decreased significantly since 2022. Both the mean and median bonus gaps continue to be more favourable for those who have declared themselves as disabled in comparison to non-disabled employees. The bonus gap is largely attributable to more disabled people in the upper quartiles receiving a bonus, as bonuses are calculated as a percentage of individual salary.
Our mean disability bonus gap is -23.7%, in favour of disabled employees, an increase of 0.3 percentage points compared to 2022.
Our median disability pay gap is -39.3%, in favour of disabled employees, a decrease of 13.3 percentage points compared to 2022.
| Difference in mean bonus pay | Difference in median bonus pay | |
|---|---|---|
| 2023 | -23.7% | -39.3% |
| 2022 | -23.4% | -52.6% |
| 2021 | -56.0% | -69.3% |
The proportion of non-disabled and disabled employees receiving bonus pay

A higher proportion of non-disabled employees received bonus pay compared to employees that declared a disability (48.2% non-disabled and 42.5% disabled).
The percentage of disabled employees receiving a bonus was 42.5%, an increase of 1 percentage point compared to 2022.
| 2021 | 2022 | 2023 | |
|---|---|---|---|
| No disability | 43.2% | 40.2% | 48.2% |
| Disabled | 39.5% | 41.5% | 42.5% |
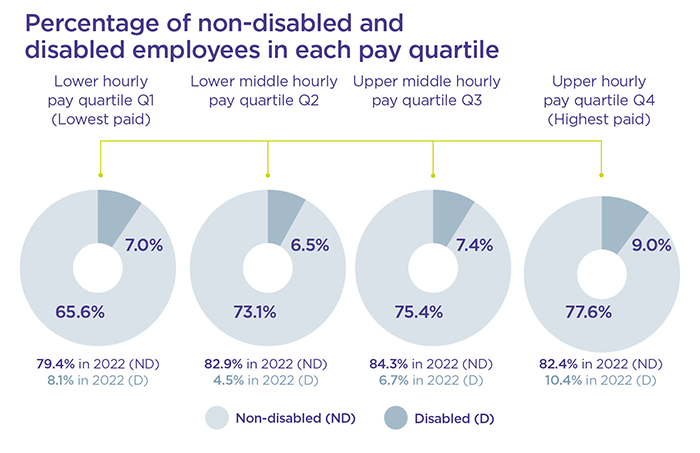
The proportion of non-disabled and disabled employees in each pay quartile
The proportion of non-disabled employees in each of the four quartiles has decreased compared to 2022. There has been a slight shift in the proportion of disabled employees across the four quartiles, with a 1.4 percentage point decrease in the highest paid, upper quartile (Q4), 0.7 percentage points increase in the upper-middle quartile (Q3), 2.0 percentage points increase in the lower-middle quartile (Q2), and 1.1 percentage points decrease in the lowest-paid, lower quartile (Q1).
The proportion of non-disabled employees continues to be lower compared to non-disabled employees across all four quartiles.
| Quartiles – Non-disabled | Quartiles – Disabled | |
|---|---|---|
| Q4 – Upper hourly pay quartile (highest paid) | 77.6% (82.4%)* | 9.0% (10.4%) |
| Q3 – Upper middle hourly pay quartile | 75.4% (84.3%) | 7.4% (6.7%) |
| Q2 – Lower middle hourly pay quartile | 73.1% (82.9%) | 6.5% (4.5%) |
| Q1 – Lower hourly pay quartile (lowest paid) | 65.6% (79.4%) | 7.0% (8.1%) |
*NB: The figures in brackets illustrate the proportion of non-disabled and disabled employees in each of the four quartiles from the 2022 disability pay analysis and have been included for comparative purposes.
Ethnicity pay gap report
We continue to make positive progress in reducing our mean and median ethnicity pay gaps. However, pay and bonus gaps still exist, which are largely attributable to fewer people from an ethnic minority in the upper quartile than those from the lowest quartiles, as bonuses are calculated as a percentage of individual salary.
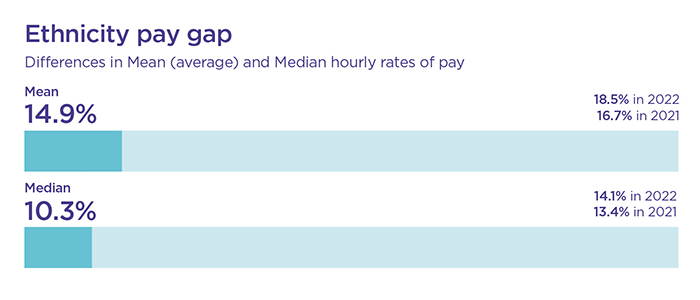
Our mean ethnicity pay gap is 14.9%, in favour of white employees, in comparison to minority ethnic employees, a decrease of 3.6 percentage points compared to 2022.
Our median ethnicity pay gap is 10.3%, in favour of white employees, in comparison to minority ethnic employees, a decrease of 3.8 percentage points compared to 2022.
| Difference in mean (average) hourly rate of pay | Difference in median hourly rate of pay | |
|---|---|---|
| 2023 | 14.9% | 10.3% |
| 2022 | 18.5% | 14.1% |
| 2021 | 16.7% | 13.4% |
Mean and median ethnicity bonus gap

We have made positive progress in reducing the mean and median bonus pay gaps, although we still have some way to go to reduce the gap further.
Our mean ethnicity bonus gap is 9.8%, in favour of white employees, a decrease of 19.4 percentage points compared to 2022.
Our median ethnicity bonus gap is -13.3%, in favour of minority ethnic employees, a decrease of 23.1 percentage points compared to 2022.
| Difference in mean bonus pay | Difference in median bonus pay | |
|---|---|---|
| 2023 | 9.8% | -13.3% |
| 2022 | 29.2% | 36.4% |
| 2021 | 17.3% | 33.0% |
The proportion of white and minority ethnic employees receiving bonus pay
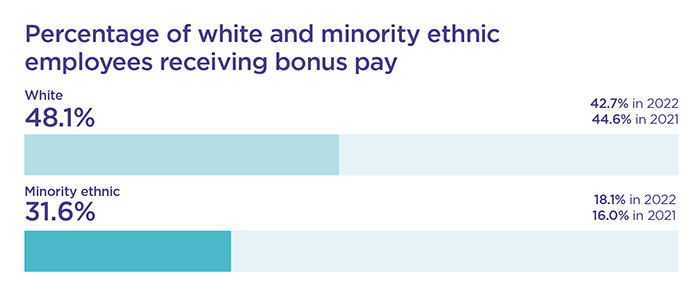
A higher proportion of white employees received bonus pay compared to minority ethnic employees (48.1% white and 31.6% minority ethnic).
The percentage of minority ethnic employees receiving a bonus was 31.6%, an increase of 13.5 percentage points compared to 2022.
| 2021 | 2022 | 2023 | |
|---|---|---|---|
| White | 44.6% | 42.7% | 48.1% |
| Minority Ethnic | 16.0% | 18.1% | 31.6% |
The percentage of white and minority ethnic employees in each pay quartile
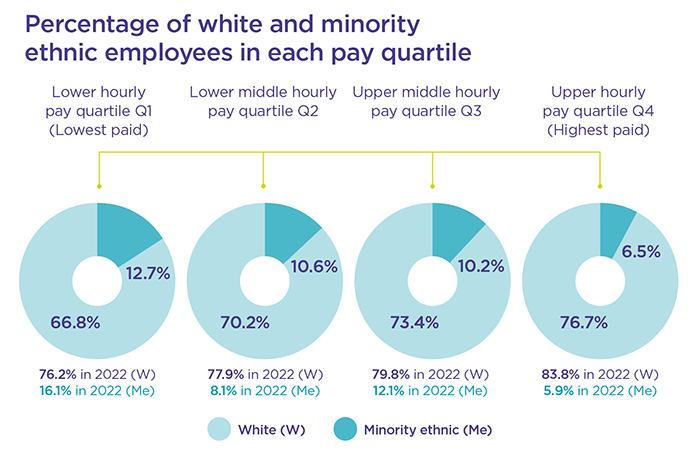
Compared to 2022, there has been a slight shift in the representation of minority ethnic employees across the four quartiles, with a 0.6 percentage point increase in the highest paid, upper quartile (Q4), 1.9 percentage points decrease in the upper middle quartile (Q3), 2.5 percentage points increase in the lower middle quartile (Q2), and 3.4 percentage points decrease in the lowest paid, lower quartile (Q1).
There continues to be a lower proportion of minority ethnic employees across all four quartiles compared to white employees. If the number of minority ethnic employees in TPR doesn’t increase overall and across roles in each of the four quartiles, we are likely to see these gaps perpetuate for the foreseeable future.
| Quartiles – White | Quartiles – Minority Ethnic | |
|---|---|---|
| Q4 – Upper hourly pay quartile (highest paid) | 76.7% (83.8%)* | 6.5% (5.9%)* |
| Q3 – Upper middle hourly pay quartile | 73.4% (79.8%)* | 10.2% (12.1%)* |
| Q2 – Lower middle hourly pay quartile | 70.2% (77.9%)* | 10.6% (8.1%)* |
| Q1 – Lower hourly pay quartile (lowest paid) | 66.8% (76.2%)* | 12.7% (16.1%)* |
*NB: The figures in brackets illustrate the proportion of white and minority ethnic employees in each of the four quartiles from the 2023 ethnicity pay analysis and have been included for comparative purposes.
Sexual orientation pay gap report
The mean and median sexual orientation pay gaps increased and are less favourable for those who identify as lesbian, gay, bisexual or recorded their sexual orientation as ‘other’ (LGB+) compared to heterosexual employees. The pay gap is driven by fewer LGB+ employees in the upper quartile than those from the lowest quartiles.
Our mean sexual orientation pay gap is 12.0%, in favour of heterosexual employees, an increase of 0.6 percentage points compared to 2022.
Our median sexual orientation pay gap is 13.0%, in favour of heterosexual employees, an increase of 1.0 percentage points compared to 2022.
| Difference in mean (average) hourly rate of pay | Difference in median hourly rate of pay | |
|---|---|---|
| 2023 | 12.0% | 13.0% |
| 2022 | 11.4% | 12.0% |
| 2021 | 10.4% | 10.1% |
Mean and median sexual orientation bonus gap

We have made positive progress in reducing the mean and median sexual orientation bonus gaps. The mean bonus gap is nearly eradicated. However, the mean sexual orientation bonus gap is still less favourable for LGB+ employees compared to heterosexual employees.
Our mean sexual orientation bonus gap is 5.2%, in favour of heterosexual employees, a decrease of 7.6 percentage points compared to 2022.
Our median sexual orientation bonus gap is -0.4%, in favour of LGB+ employees, a decrease of 11.1 percentage points compared to 2022.
| Difference in mean bonus pay | Difference in median bonus pay | |
|---|---|---|
| 2023 | 5.2% | -0.4% |
| 2022 | 12.8% | 11.5% |
| 2021 | 3.3% | 33.6% |
The proportion of heterosexual and LGB+ employees receiving bonus pay

A higher proportion of employees who identified as heterosexual received bonus pay compared to those who identified as LGB+ (47.8% heterosexual and 38.6% LGB+).
However, a greater proportion of LGB+ employees received bonus pay in 2023 than in 2022, an increase of 5.3 percentage points.
| 2021 | 2022 | 2023 | |
|---|---|---|---|
| Heterosexual | 41.0% | 40.9% | 47.8% |
| LGB+ | 41.8% | 33.3% | 38.6% |
The percentage of heterosexual and LGB+ employees in each pay quartile
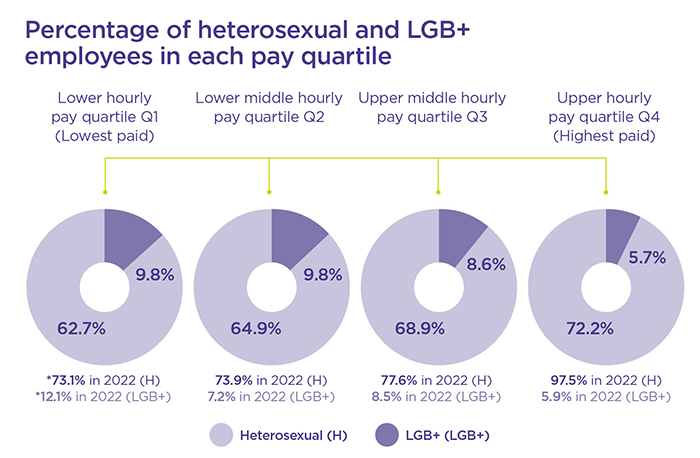
The proportion of LGB+ employees in Q2, Q3 and Q4 has decreased since the 2022 report.
Compared to 2022, there has been a slight shift in the representation of LGB+ employees across the four quartiles with a 0.2 percentage point decrease in the upper (highest paid) quartile (Q4), 0.1 percentage points increase in the upper-middle quartile (Q3), 2.6 percentage points increase in the lower-middle quartile (Q2), and 2.3 percentage points decrease in the lower (lowest-paid) quartile (Q1).
| Quartiles – Heterosexual | Quartiles – LGB+ | |
|---|---|---|
| Q4 – Upper hourly pay quartile (highest paid) | 72.2% (97.5%) * | 5.7% (5.9%) * |
| Q3 – Upper middle hourly pay quartile | 68.9% (77.6%) * | 8.6% (8.5%) * |
| Q2 – Lower middle hourly pay quartile | 64.9% (73.9%) * | 9.8% (7.2%) * |
| Q1 – Lower hourly pay quartile (lowest paid) | 62.7% (73.1%) * | 9.8% (12.1%) * |
*NB: The figures in brackets illustrate the proportion of heterosexual and LGB+ employees in each of the four quartiles from the 2022 LGB+ pay analysis and have been included for comparative purposes.
Taking action on our diversity pay gaps
Key actions we have taken to improve our pay gaps over the last year
Improve recruitment and promotion processes
- We continue to capture workforce diversity information against our EDI strategy’s target and have launched a project to explore how we can improve capturing diversity information via the recruitment process within our HR information system.
- We provided hiring managers with guidance on building more diverse panels and integrated reminders into recruitment campaign meetings.
- We delivered tailored recruitment sessions to support colleagues applying for roles and preparing for interviews for our minority ethnic and LGBT+ network. The sessions have also been offered to our other diversity networks.
Career development and progression
- Our diversity networks were supported to find inspirational speakers to share their lived experience and insights on career progression for a minority ethnic network cultural event, Black History month, Mental Health Awareness Day, and International Men’s Day.
- All our people managers are being provided with a new, six-module course, which includes developing positive and inclusive behaviours.
- We are establishing coaching and mentoring to support under-represented groups progressing to more senior roles. We will explore partnerships with groups as part of this work.
- We launched our Talent and Development three-year plan in 2023.
Flexible working and job-sharing
- We continue to actively promote flexible working and job-sharing opportunities in our recruitment adverts to support a good work life balance.
Apprenticeships
- Apprenticeships form part of our learning and development for employees and we continue to work with apprentices recruited externally. This continues to be an important aspect of our Talent and Development Strategy and is one that we are currently reviewing to ensure it remains relevant and accessible as we enter a period of significant transition and organisation design.
Measure and evaluate policies to support diversity and inclusion
- We analyse EDI trends on a quarterly basis and have developed a dashboard that allows us to engage with specific departments and understand local trends.
- By the end of March, working in partnership with external specialists, we will have completed a review of our bonuses, including an evaluation of our practices across different roles and pay gaps and those with protected characteristics.
- We continue to collect data from exit questionnaires and use this information to inform our people processes, our diversity and inclusion strategy, and the related actions. A new starter information and diversity declaration will be embedded into our onboarding process.
- We continue to use our pay and bonus data to help us understand the causes of our organisation’s pay gaps for gender, disability, ethnicity and sexual orientation.
- As part of the EDI annual action planning exercise, we monitor and report on progress with our EDI Committee and RapCo (Remuneration and People Committee).
We will provide a report of progress towards our wider EDI strategy in our Annual Report and Accounts 2023 to 2024, published in summer 2024.
Future actions we are taking to improve our pay gaps
While we are encouraged by positive progress towards reducing our pay gaps this year, we know we have more work to do. Over the next year we will take the following actions focused on improving recruitment, learning and development, policy, and pay and performance.
Recruitment
- We are implementing an applicant tracking system in 2024 to 2025 and will encourage voluntary diversity data declaration as part of the recruitment process. Insights from this process will be used to monitor and assess the gender, ethnicity, sexual orientation and disability diversity of our candidates at application, selection and appointment stage.
- We will design a process for collecting feedback from candidates that make it to the interview stage, and for interview panel members, with questions on alignment to values and our inclusive recruitment standards.
- We will ensure all hiring managers and interview panellists have undertaken inclusive recruitment training by October 2024.
- We will establish a cohort of diverse interview panellists from across the organisation.
- We will ensure diverse interview panels for all senior leadership positions.
- We will continue to offer tailored recruitment sessions to the Diversity network on an annual basis.
- We will provide a series of application review, mock interview and lunch and learn sessions to colleagues from underrepresented groups every other month.
- We will work with our Minority ethnic and PROUD networks to design an action plan for improving ethnic and LGB+ diversity in senior leadership positions.
Learning and development
- We will continue delivering inclusive management training for our people managers.
- We will deliver a coaching programme for individuals from underrepresented backgrounds.
- We will design and deliver inclusive leadership and diversity training for our executive committee by December 2024 and our senior managers in 2025.
Policy
- We will ensure EDI considerations are embedded into the approach of the planned HR policy review.
- We will continue to encourage diversity declaration at induction and onboarding stage and conduct an annual declaration drive to ensure data reliability and accurate pay gap reporting.
- We will utilise our management information to provide directorate-level data, engage with teams to understand and identify actions, and to provide a directorate plan that they can take to improve diversity pay gaps.
- We will sign up to the Business in the Community Race at Work Charter, making our public commitment to improving equality of opportunity in the workplace.
- We will utilise the findings from this pay gap report to refresh our EDI action plan to ensure our policies and focus remain effective and up to date.
Pay and performance
- We will review and refresh our approach to objective setting, with a campaign to communicate our bonus approach.
- We engaged an external organisation to review our bonus approach, and insights from this pay gap analysis fed into that review. We will utilise the findings and recommendations from that exercise to identify further action that can be taken to reduce our bonus pay gaps.
- We will continue to improve transparency on pay and promotion processes. We are conducting a three-year pay review, and the findings from this process will inform further action planning to improve pay gap outcomes.
Declaration
We confirm that data reported by the Gender Pay Gap Report 2023 is accurate and has been calculated according to the requirements and methodology set out in the Equality Act 2010 (Specific Duties and Public Authorities) Regulations 2017.
Paula Harris
Director of People and Culture
Endnote for this page
Transgender and non-binary staff reporting – the Equality Act 2010 (Gender Pay Gap Information) Regulations 2017 require employers to calculate their gender pay gap by comparing the pay of their male and female employees. The terms ‘men’ and ‘women’ are not defined in the regulations, leaving employers to decide for themselves how to categorise and include transgender and non-binary employees in their reporting. Government guidance says if the employee does not self-identify as either male or female, they can be omitted from calculations.
At The Pensions Regulator, we capture data on sex under three options, ‘male’, ‘female’ and ‘other'. In line with the regulations, only those who self-identify as ‘male’ or ‘female’ are included in the calculations. Those who self-identify as ‘other’ are omitted from the gender calculations as the sample size is too small, and we would not be able to protect anonymity. We do not capture data on gender identity. We capture data on gender reassignment, but we are unable to report on gender reassignment calculations as the sample size is too small, and we would not be able to protect anonymity. We acknowledge that this does not reflect our efforts towards inclusion of the trans and non-binary community and we are exploring how our reporting can be more inclusive going forward.
The ‘Ethnic’ category now includes ‘Other ethnic groups’ and the ‘LGB+’ category now includes people who identify their sexuality as ‘Other’. For calculations including bonus, any bonuses paid to people leaving TPR during the relevant year are now excluded.


